

Most advice on how to Improve Core Web Vitals starts the same way. Run your homepage through PageSpeed Insights, fix whatever turns red, repeat until the number looks better. That's tidy, and often the wrong order.
Your homepage may pass while your booking, checkout, contact, or service pages fail. Those templates carry different images, scripts, forms, and embeds, and they're where visitors actually become leads or customers.
Treat this as template triage. Find which metric fails for real visitors, decide which templates matter commercially, then fix the specific bottleneck. A prettier lab score on the wrong page won't help the person trying to submit your form on a slow phone.
Passing Thresholds for LCP, INP and CLS
A page passes only when the 75th percentile of real Chrome visits meets the good threshold for LCP, INP, and CLS. All three must pass. A strong result on one metric doesn't offset failure on another, and Google classifies good as 2,500 milliseconds or faster for LCP, 200 milliseconds or faster for INP, and 0.10 or lower for CLS, based on Chrome's PageSpeed Insights guidance on Core Web Vitals thresholds.
| Metric | Good | Needs Improvement | Poor |
|---|---|---|---|
| LCP (Largest Contentful Paint) | 2.5 seconds or less | 2.5 to 4.0 seconds | Over 4.0 seconds |
| INP (Interaction to Next Paint) | 200 milliseconds or less | 200 to 500 milliseconds | Over 500 milliseconds |
| CLS (Cumulative Layout Shift) | 0.10 or less | 0.10 to 0.25 | 0.25 or higher |
LCP tracks when the main content appears on screen, usually a hero image or large heading. INP tracks how quickly the page responds to clicks, taps, and key presses across the visit, not just the first interaction. CLS tracks how much visible content moves unexpectedly during loading and afterward.
The middle range matters. A 3.8-second LCP isn't poor yet, but it's still worth fixing because it needs improvement. Percentiles also expose visitors that averages can hide. If three quarters of visits finish quickly enough, you pass. If that 75th-percentile visitor waits much longer, a respectable average won't save the result.
Measure Field Data Before You Touch Code
Lab and field data answer different questions. Lighthouse runs a simulated test in controlled conditions and helps isolate likely causes. Field data shows whether actual visitors pass, and Google's Search Console report uses CrUX field data from actual users, while Lighthouse tests a controlled environment, according to Google Search Central guidance on Core Web Vitals.
| Tool or Report | Data Source | Best Use | Main Limitation |
|---|---|---|---|
| PageSpeed Insights, field section | Chrome UX Report real-user data over a rolling 28 days | Confirming pass or fail at the 75th percentile | Hidden for pages with too little traffic |
| PageSpeed Insights, Lighthouse section | One simulated lab run | Reproducing the problem and finding the likely cause | A good lab score does not prove real visitors are fast |
| Search Console Core Web Vitals report | Chrome UX Report data grouped by similar URLs | Spotting failing templates across the site | Groups update slowly and cover only some URLs |
| Chrome DevTools Performance panel | One trace recorded on your own machine | Finding long tasks and layout shift sources | Requires manual, repeatable setup for each interaction |
Use the tools in this order
- Start in Search Console. Note which mobile page groups are poor or need improvement.
- Open PageSpeed Insights. Run the worst template and read the field section first.
- Use Lighthouse second. Keep mobile throttling on and look for the likely cause.
- Record the baseline. Write down the failing metric, its 75th-percentile value, and the template.
Practical rule: Field data decides whether visitors have a problem. Lab data helps you find why.
A desktop Lighthouse score of 95 doesn't prove mobile visitors on slower connections get a fast page. Device, network, geography, caching, consent state, and template differences all change real results. If you're also reviewing basic load behavior, our guide on checking your website speed can help you separate a quick spot check from field evidence.
Low-traffic pages may have no field data. Test those on a real phone over a weak connection instead of assuming they're fine. Also expect delay after a fix. Field reporting uses a rolling 28-day window, so improvement can take weeks to show fully. When averages look fine but complaints persist, segment by device, country, template, and connection.
Pick the Templates Worth Fixing First
When several templates fail, don't spread a small budget evenly across all of them. Rank the work by business impact first, severity second.
- Revenue and leads first. Booking, checkout, product, service, and contact templates come before archives.
- Poor before needs improvement. A severe failure on a valuable template outranks a mild miss elsewhere.
- Mobile and desktop separately. Compare each template's 75th-percentile LCP, INP, and CLS for both segments.
- Traffic matters. A failing template with steady conversions deserves attention before a rarely visited page.
Use three kinds of evidence together. Lab data identifies a likely cause, field data confirms how many real visitors are affected, and analytics decides which template gets engineering time first.
Consider a clearly labeled hypothetical. The homepage passes all three metrics, but the booking template has poor mobile INP and produces most leads. The booking page goes first, even though the homepage looks better in a screenshot you'd send around internally.
That's the tradeoff. Optimizing every page equally sounds fair, but it can leave the important template half fixed. A rarely visited archive that needs improvement and drives no business may not justify custom development. Your goal isn't a perfect sitewide score. It's a better experience on the pages visitors use to evaluate, contact, book, or buy.
How to Fix a Slow LCP Step by Step
Start with one decision. Is the bottleneck the server, or is it the page itself?
If time to first byte is high on uncached requests, server response and caching come first. If the server responds quickly but the LCP element is a large image, image discovery and delivery come first. The field-first workflow is to establish a CrUX or Search Console baseline, reproduce the slow template under throttled mobile conditions, isolate the dominant phase, deploy one change at a time, then recheck field data, as described in web.dev guidance on measuring and improving Web Vitals.
The sequence below keeps you from polishing an image when the server is the actual delay.
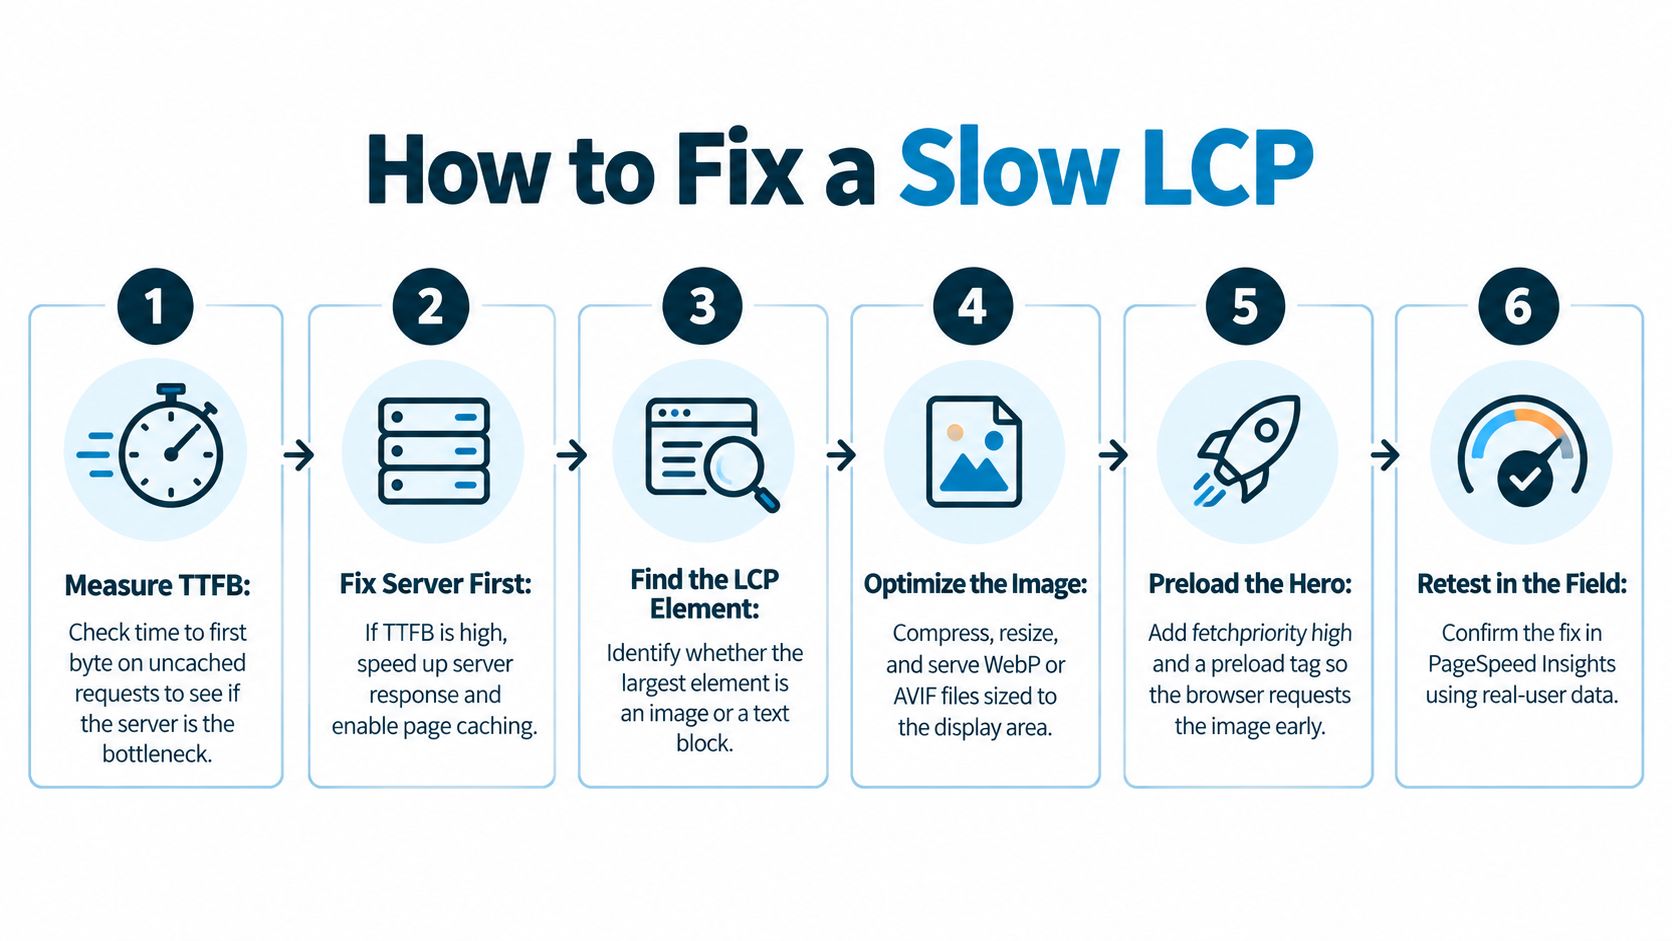
Six steps that address the usual causes
- Check server response. Test cached and uncached requests for the slow template. Confirm page caching or a CDN is actually serving static content, not merely installed.
- Identify the LCP element. PageSpeed Insights and DevTools name it for you. It's often the hero image, but it can also be a large heading or text block.
- Make the hero discoverable early. Don't lazy load the LCP image. Give it high fetch priority, and preload it when the browser only discovers it late through CSS.
- Serve the right file. Export near the displayed dimensions, compress it, use WebP or AVIF where supported, and provide responsive
srcsetsizes so phones don't download a desktop-sized image. - Reduce render blocking. Inline the CSS needed above the fold where practical, defer scripts visitors don't need immediately, and remove CSS or JavaScript that the template doesn't use.
- Retest under mobile throttling. Change one thing at a time so you know what helped. Then wait for enough field traffic before declaring victory.
Don't optimize the element you assume is largest. Confirm it in the report, because redesigns and new hero sections can change the answer.
Watch the tradeoffs
Aggressive caching can serve stale content if cache rules are sloppy, especially around logged-in areas, carts, or frequently updated pages. Test those paths after changing cache settings. Cheap or overloaded hosting can also undo careful image work. If every uncached request waits on the server, a smaller hero file only fixes part of the delay.
Preloading needs restraint too. Preload the actual LCP asset, not five images you hope might matter. Extra preloads compete for bandwidth and can slow the one file you're trying to prioritize.
Recheck the LCP element whenever the template changes. A new slider, video poster, headline treatment, or hero layout can move the bottleneck. For broader delivery work, including caching and code cleanup, see these website performance optimization tips.
Cut INP Delays From JavaScript and Third Parties
Older checklists focused on First Input Delay, which mainly covered the first interaction. INP replaced FID and evaluates responsiveness across interactions during the visit, and Chrome notes it can keep updating until the page is exited, according to Chrome guidance on INP measurement.
That distinction matters on real business pages. The first click may feel snappy, then a filter, menu, cart update, or form submission stalls. That later delay can still define the visitor's experience.
The photo below is not the workflow, but it is the setting where this work usually happens, one trace and one stubborn interaction at a time.

Trace the interactions visitors actually use
- Record real paths. In the DevTools Performance panel, open the menu, filter results, add an item to the cart, and submit a test form.
- Find long tasks. Look for extended main-thread work and identify which event handler starts it.
- Split expensive handlers. Break large jobs into smaller pieces and yield to the browser between them so it can paint a response.
- Audit third parties. Review chat widgets, tag managers, testing tools, social embeds, and analytics extras. Remove unused scripts, delay nonessential ones, or load them after interaction where that won't break reporting.
- Check repeated rendering. Long lists and page frameworks sometimes rebuild far more of the page than a filter change requires.
- Retest the same path. Use the same device settings and interaction sequence, then confirm the change in field data over the next reporting window.
The video below gives a useful visual walkthrough of interaction debugging before you start removing scripts at random.
Third-party decisions need the business owner in the room. A tag may look expendable to a developer while marketing depends on it for campaign reporting. Decide which scripts earn their cost, document why they stay, and test replacements on staging. On WordPress sites, plugins and page builders often load scripts sitewide, including pages that never use the feature. That's usually a better cleanup target than shaving a few lines from a handler that runs once.
Stop Layout Shifts From Images, Embeds and Fonts
CLS counts unexpected movement of visible content. It doesn't punish intentional animation or a change the visitor triggered, like opening an accordion. The annoying case is the button that moves just as someone tries to tap it.
| Shift Source | Typical Cause | Fix |
|---|---|---|
| Images and videos | No width and height attributes or aspect ratio set in CSS | Set dimensions or an aspect-ratio before the file loads |
| Ads, embeds and iframes | Slot height not reserved and content inserted late | Reserve a fixed-height container sized to the most common format |
| Web fonts | Fallback text swapped for a webfont with different sizing | Preload key fonts and use a metric-matched fallback with a controlled font-display setting |
| Cookie banners and notices | Inserted above existing content after load | Overlay the content or reserve space in the layout before the banner appears |
| Late-loading widgets | Components rendered after a data request finishes | Render a placeholder with a fixed height that matches the final component |
Find shifts the lab run misses
Lighthouse mainly exposes shifts during load. Banners, ads, embeds, reviews, and consent tools can shift content later, after scrolling or after a data request returns. Turn on layout shift regions in DevTools, scroll the template, wait for late widgets, and compare what you see with field complaints.
Reserving space sounds simple until design gets involved. A fixed-height ad slot prevents jumps, but it can leave an empty gap when no ad fills. Size it for the most common format rather than the tallest possibility. A cookie notice that overlays content avoids pushing the page down, though placement and wording may involve privacy requirements. Don't let a performance fix create a compliance problem without anyone noticing.
Fonts involve brand judgment. A metric-matched fallback reduces the visible swap when the webfont arrives, but the fallback may not look like your brand font. Preloading one key font file can help. Preloading an entire font family usually creates a new bandwidth problem.
Images are the easiest place to start because dimensions are predictable, and our guide on optimizing images for the web covers sizing alongside compression. Finish with a manual phone test. Load your most visual template, scroll once, wait, and note anything that moves after the first paint.
Build a Monthly Check for Your Key Templates
Passing scores drift. A new tracking script, a plugin update, a larger hero image, a chat widget, or a font change can push a healthy template back into needs improvement. And the baseline is already low: the HTTP Archive Web Almanac performance chapter puts the 2024 pass rate at 43% of mobile origins for all three metrics together, LCP, INP, and CLS.
A dashboard with forty charts won't fix that. A short routine will, as long as it ties monitoring to releases and to the templates that carry the business, rather than the homepage that happens to look clean in PageSpeed Insights.
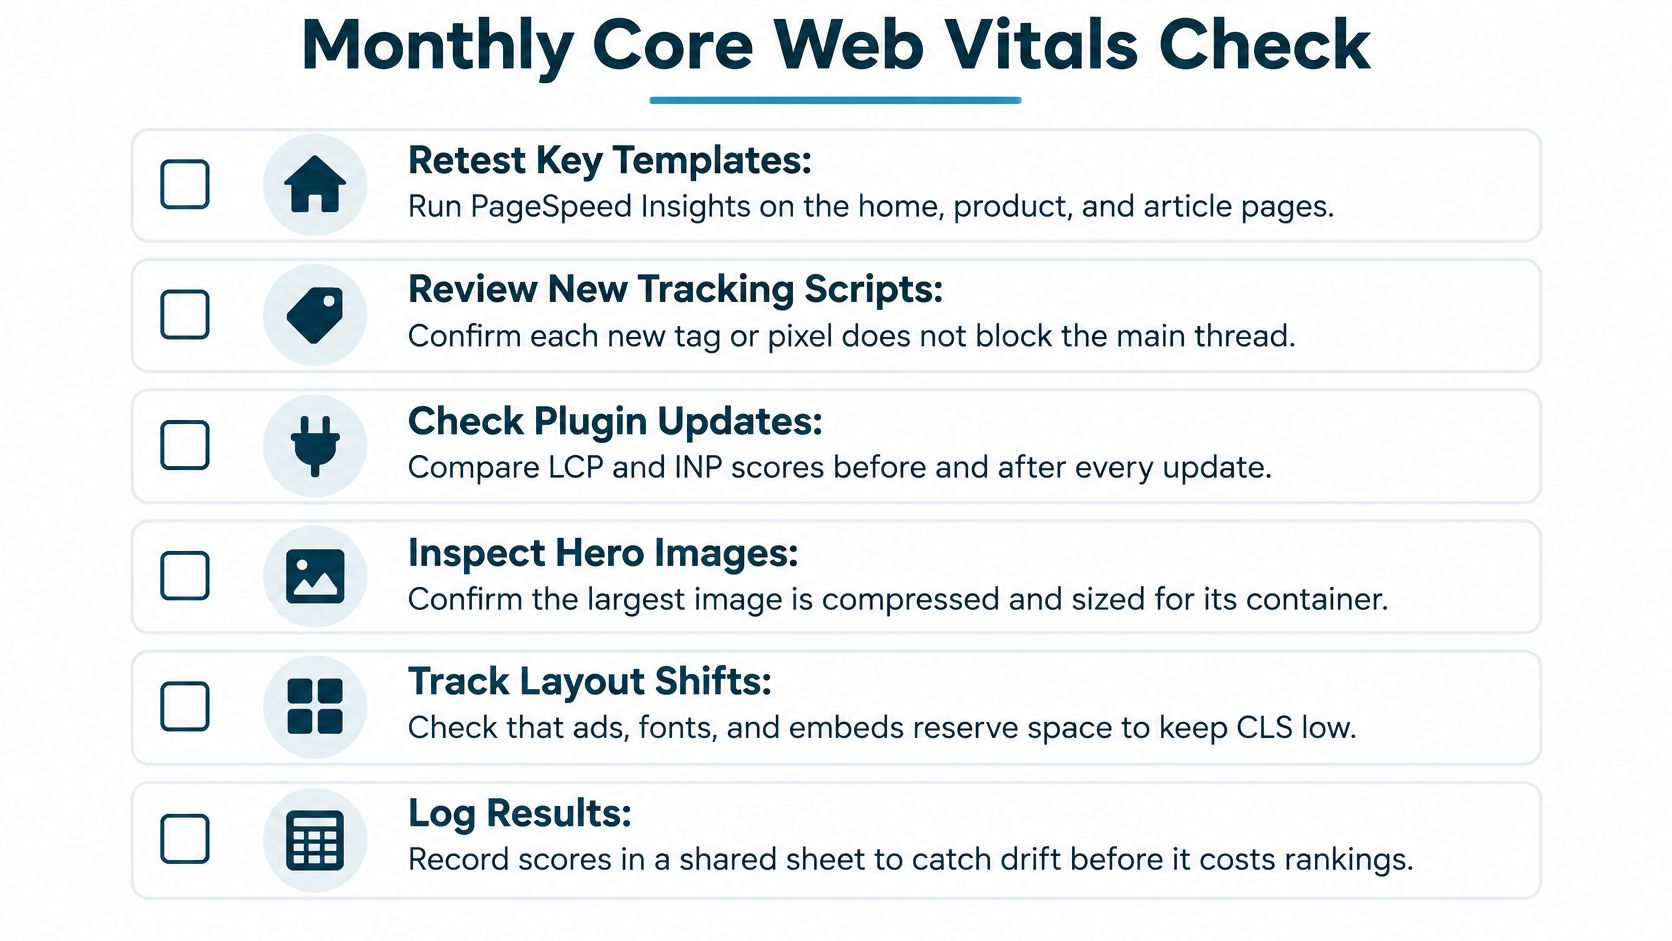
A monthly routine small teams can keep
- Pick five to ten templates. Include the homepage, key service or product pages, booking or checkout, contact, and one typical article.
- Record mobile and desktop separately. Log the 75th-percentile LCP, INP, and CLS from Search Console and PageSpeed Insights.
- Keep a change log beside the numbers. Note releases touching scripts, images, fonts, plugins, tags, hosting, or caching.
- Test new tools on staging. Run the main interaction paths before a chat, testing, or personalization tool reaches production.
- Investigate slips in order. Check the change log first, then reproduce the issue in Lighthouse or DevTools.
- Use the same review day each month. That keeps each check tied to a comparable 28-day field window.
A metric rarely gets worse for no reason. The change log often names the suspect before the trace does.
Not every template needs a perfect score. Removing an analytics tag can blur reporting your team relies on, so write down the tradeoffs you accept instead of rediscovering them every quarter. When performance work overlaps with crawl, indexing, or template problems, a broader technical SEO audit process helps you decide what belongs in the same project.
If nobody internally has time to keep this routine, treat it as a maintenance decision. Hand off the monitoring, release checks, and fixes before small drift becomes a rebuild conversation.
If your key pages keep slipping or your team can't tell whether the problem is hosting, images, JavaScript, or template code, Bruce & Eddy can audit the templates that drive leads and handle the development and maintenance work behind the fixes. Visit Bruce and Eddy to talk through what your field data is showing and which page should be fixed first.
